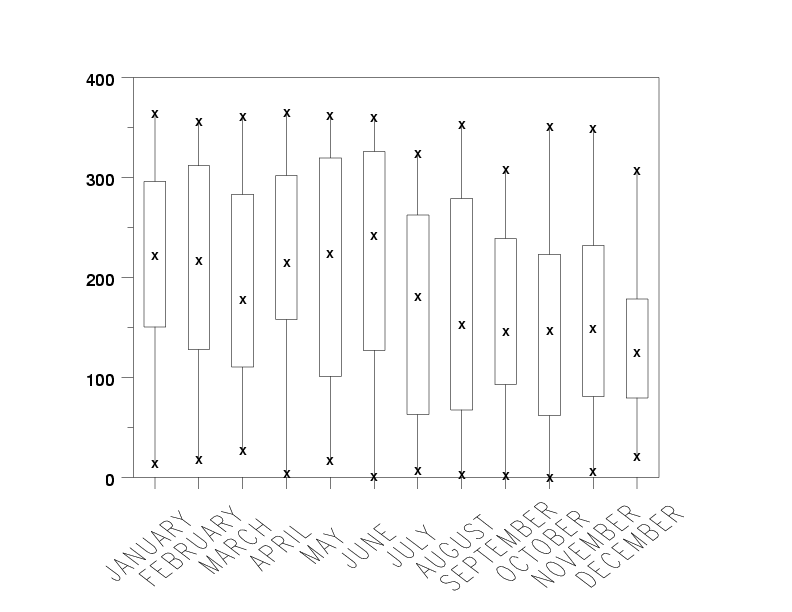
Box plots graphically describe groups of numerical data through their five-point summary (smallest observation, lower quartile, median, upper quartile and largest observation). The spacing between each of the five points describes the size of dispersion between observations and helps to identify outlying data. This map describes some unknown variable observed over a 12-month period.
Taken from HERE.
