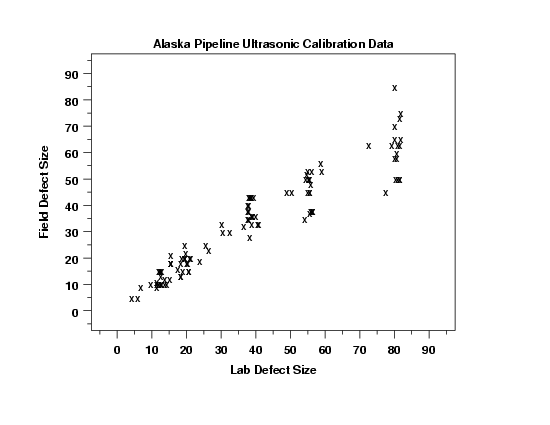
A scatter plot map used to analyze calibration data for measurements observed by engineers working on the Alaksan oil pipeline. Scatter plots reveal correlation details between two variables, in this case a more or less linear relation between Lab Defect Size and Field Defect Size.
Showing posts with label Scatter Plot. Show all posts
Thursday, August 7, 2008
Scatter Plot
A scatter plot map used to analyze calibration data for measurements observed by engineers working on the Alaksan oil pipeline. Scatter plots reveal correlation details between two variables, in this case a more or less linear relation between Lab Defect Size and Field Defect Size.
Subscribe to:
Posts (Atom)